If you have been paying attention to the SaaS world, you would have noticed that usage-based pricing (UBP) is now everywhere.
A 2021 report by OpenView found that 45% of SaaS companies had usage-based components as part of their pricing. Not only did the adoption almost double over the last three years, but it is also expected to reach 79% by 2023.
Clearly, this trend is not going anywhere, but many still wonder: does usage-based pricing actually work?
In my experience, yes.
During my time at Landbot, I led our team to implement usage-based pricing, and it ended up increasing our net revenue retention by 26%!
While the result was great, getting usage-based pricing right was far from easy. I have not seen many stories detailing how companies make the transition, so I decided to share how we did it and what I learned along the way.
Before UBP, there were tiers and seats
To give you some context:
Landbot is a no-code chatbot builder that helps businesses automate their customer interactions, such as lead generation, customer support, surveys, quizzes, user onboarding, and so on.
Our previous pricing model was based entirely on feature tiers and seats, which meant that a customer generating 100,000 chats per month and a customer generating 100 chats per month would pay us exactly the same amount.
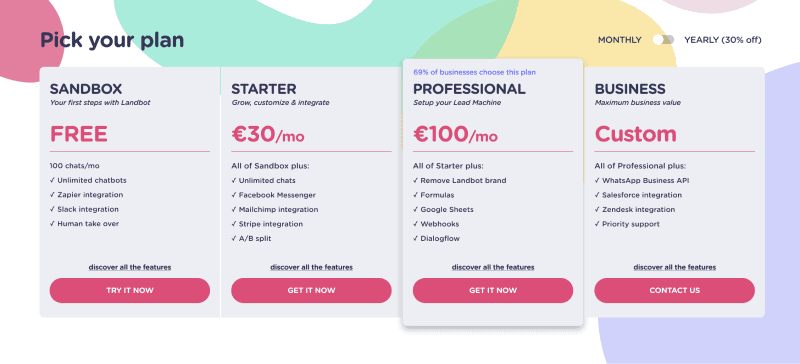
Intuitively, we believed there was an opportunity to monetize the usage, so we set out to experiment with usage-based pricing as soon as we closed our new funding round.
Research
Pricing is a highly sensitive topic that can have irreversible impacts. Considering that no one on our team had prior experience, we decided to hire an external consultant to help us.
We divided the research into three sprints. Each sprint took 2-3 weeks to complete, covering research design, data collection, analysis, and discussions.
Sprint 1: Buyer persona
We already had a fairly good idea of who our ideal customers were, but we wanted to further validate our qualitative understanding by looking at:
- Internal data (enriched by Clearbit) – conversion rate, retention rate, long-term retained customers, and newly acquired customers.
- Price sensitivity survey results from an external research panel.
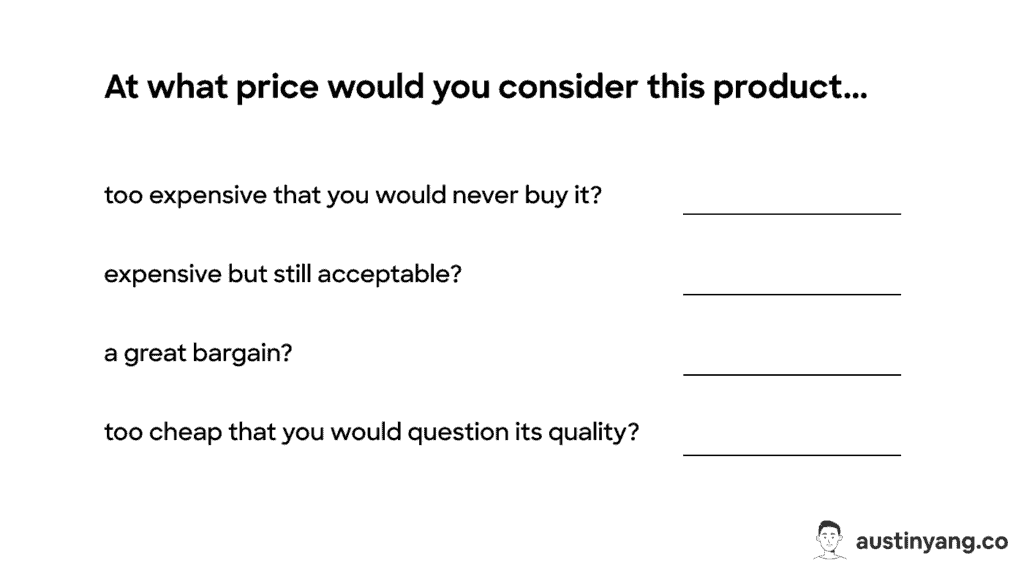
The resulting output was a set of firmographic and demographic attributes of our ideal and secondary customers that we could use to segment our data in the following sprints.
Sprint 2: Feature packaging & value metrics
The goal of this second sprint was to find out:
- How highly is each feature valued? -> We wanted to see if we could refine the features that go into each tier (or decide whether to keep feature tiers at all).
- Aside from features, how do customers think our pricing should scale? -> So we could find the value metric for our usage component.
To do so, we used MaxDiff survey to understand each respondent’s most-valued and least-valued options in a list of features (relative preference). We also sought to understand their willingness to pay (WTP) by using the price sensitivity survey.
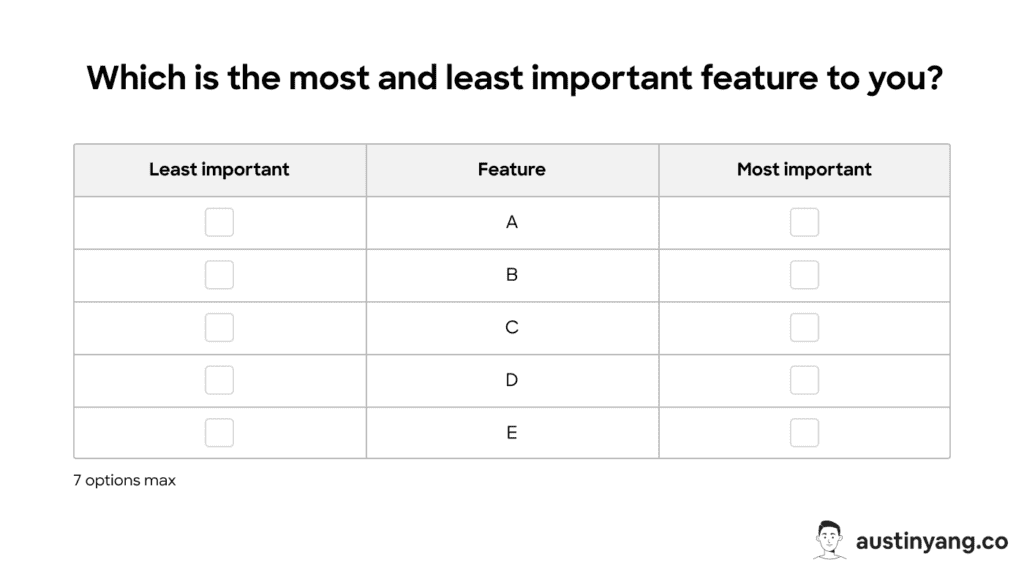
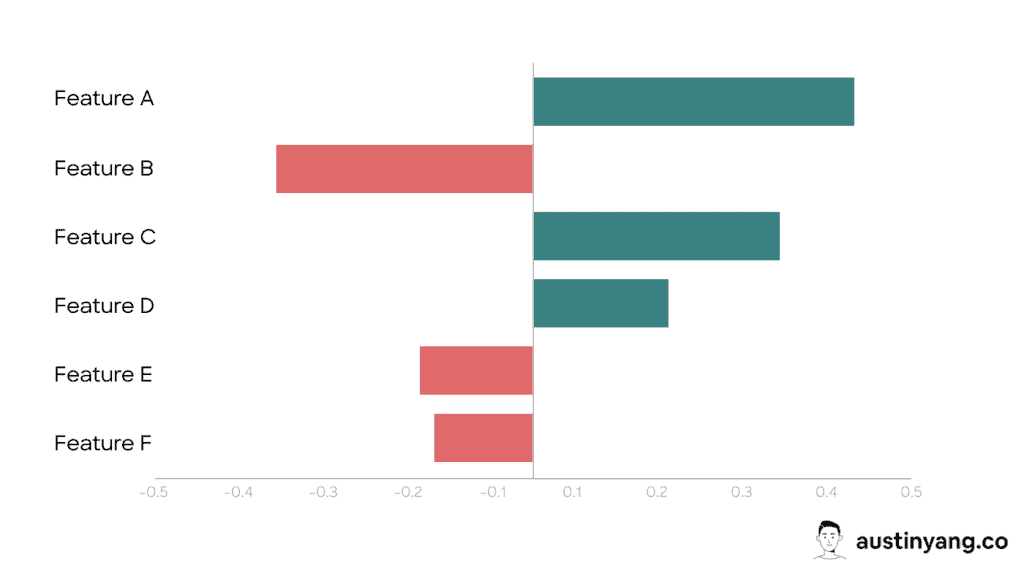
Once we had the relative preference and WTP data for each feature, we plotted them onto a 2×2 matrix where the Y-axis represents the relative preference and the X-axis represents the deviation from the median WTP.
Each feature fell into one of four quadrants:
- Differentiator (high RP x high WTP) = Customers are willing to pay more for it -> Higher tiers.
- Table Stakes (high RP x low WTP) = Customers see it as a “must-have” but don’t want to pay more for it -> All tiers.
- Add-on (low RP x high WTP) = Some customers find it valuable and are willing to pay for it -> Horizontal add-on.
- Trash (low RP x low WTP) = Customers don’t really care about it.
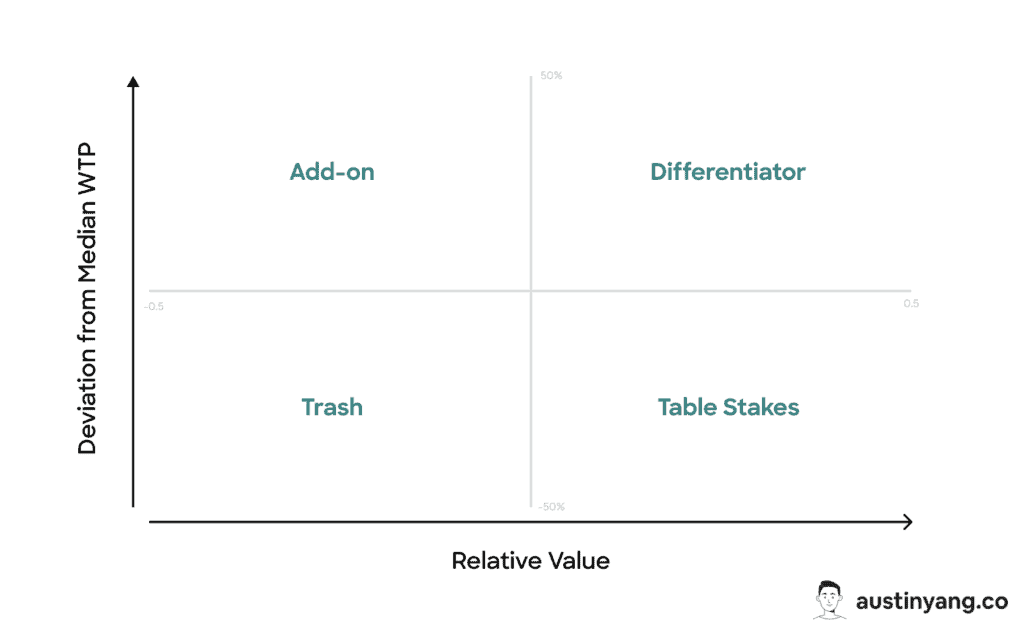
Surprisingly, the result was almost identical to our existing packaging, so we kept our feature tiers untouched.
We also went through the same process for value metrics. But instead of using the matrix, we looked at whether the WTP for each value metric scales with its potential volume. Eventually, we decided on “number of chats” as the new usage metric while also keeping seats and feature tiers.
Sprint 3: Price points
In the final sprint, we were interested in nailing down the price points by again running the price sensitivity survey. However, this time:
- We presented concrete feature tiers to the research panel.
- We asked them to estimate their potential usage volume (based on proxies like website traffic, number of leads, etc).
We then performed the Van Westendorp Price Sensitivity Analysis to find the optimal price range for each tier. 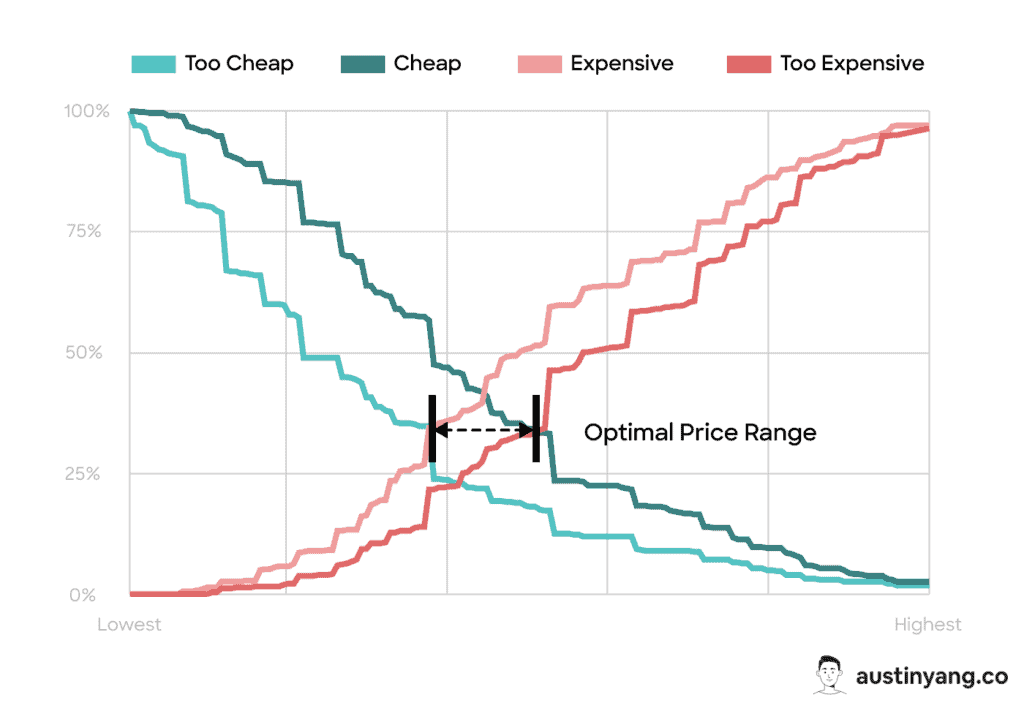
Once the ranges were established, the only remaining question was whether the usage part should be banded (fixed allowance per tier) or continuous (charge for every X amount of usage). In the end, we decided to combine the two: customers get a free allowance but have to pay extra for overage.
NOTE: We conducted the research with an external panel who fits our buyer persona. We didn’t bother surveying existing customers because they had the incentive to not be honest.
Of course, data from non-customers has its own set of biases, but it’s the lesser of two evils.
Enjoying this post so far? Subscribe for more.
Experimentation
To ensure the usage component wouldn’t have any negative impact, we started it off as an experiment.
The original idea was to run the new pricing as an A/B test. However, upon realizing that it would take at least a year to reach statistical significance and that there was virtually no way to prevent users from seeing the other variant, we decided to launch it to all new users.
After three months, we reviewed how it performed against the old pricing in terms of:
- Pricing page visit-to-Signup %
- Signup-to-Paid %
- Average selling price
- M2 logo retention
- M2 NRR
(M2 = proxy for long-term retention)
We found that the new pricing did not hurt any of the key metric, but it did increase NRR by 26%!
This gave us the confidence to fully commit to UBP and continue testing different iterations.
After three iterations, we chose the best-performing version and have kept it to this day:

NOTE: I later talked to several late-stage PLG companies that had also gone through similar pricing changes. None of them ran any A/B test for the same reasons I shared above. If you need more convincing, here is an article by Patrick Campbell detailing why you shouldn’t A/B test pricing.
Learnings
What boosts your monetization might hurt your acquisition and retention
Usage-based pricing often introduces friction in the buying process. Users need to understand how usage is calculated, estimate their required volume, and work out the potential cost. Even if they upgrade, there’s always a chance that they’ll churn after getting a surprise bill.
In essence, the effect isn’t always net positive. Therefore, it’s worth thinking about how UBP fits your growth model.
For example, if your revenue is mostly sales-driven and has an underlying cost to serve that scales with usage, then usage-based pricing could be a great fit. However, if your product is mainly self-serve and relies on virality to drive acquisition, sacrificing conversions in exchange for a higher ARPPA might not be worth it.
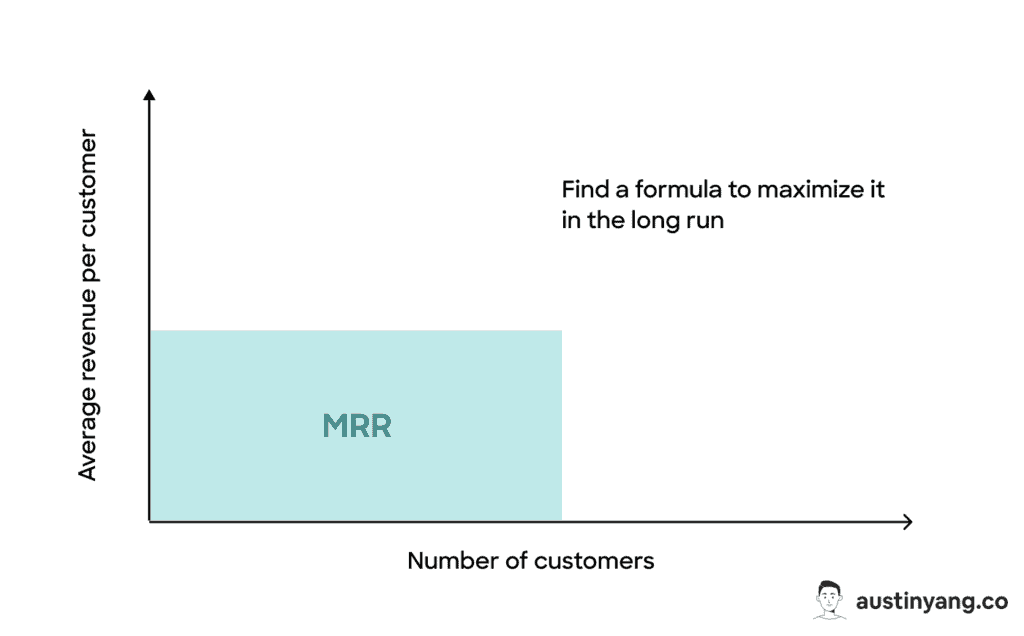
Another way to look at it is by picturing your monthly recurring revenue (MRR) as a two-dimensional graph. To grow it, you can improve either:
- The number of paying customers
- The average revenue per paying customer
A pricing change can accelerate your revenue growth in one direction but hurt it in the other. Your goal is to find a formula that will yield the most MRR growth in the long run.
Get your value metric right (outcome vs usage, cumulative vs one-off)
Although it’s called “usage-based” pricing, users usually prefer getting billed for successful outcomes. Unfortunately, outcome-based metrics aren’t always realistic. For example, if your product is a project management software, how do you accurately define or track user success?
This is why many SaaS companies stick to usage-based metrics as they are the best available option. It was also true in our case.
When the result of our value metric research came back, “number of leads” was rated as the most preferred option.
However, we went against the data and picked “number of chats” because:
- Everyone has a different definition of “leads.”
- Although lead capturing was our top use case, we did not want to be seen as a vertical solution.
The good news is that SaaS users today have become accustomed to paying for usage, so it is still an acceptable option.
Another aspect to consider when choosing your value metric is whether it should be cumulative or one-off.
Cumulative metrics, such as “total number of user records,” are more predictable and tend to only go up. One-off metrics, such as “number of emails sent,” can fluctuate up and down more unpredictably.
As a business, you probably see cumulative metrics as the better option, but your users might not always agree. Make sure to consider their view, the nature of your product, and the norm of the competitive landscape.
Generally speaking, cumulative metrics work better with products that act as a system of record (e.g. CRM, analytics), whereas one-off metrics work better with workflow automation tools (e.g. business process automation, email marketing).
Make sure you have the technical and operational capacity
Usage-based pricing adds complexity to your billing system. You have to consider things like:
- Should the usage be billed in arrears or upfront as credits?
- How precise should your billing increment be?
- How do you handle refunds, plan changes, and bulk discounts?
- Should you notify customers when they are about to use up their allowances?
You also have to prepare your sales and customer success teams to handle communications regarding UBP. This requires an entirely new playbook on processes, contract negotiation, and even compensation.
Last but not least, don’t forget about your finance team. Their involvement is crucial if you want to correctly report your usage revenue.
To be frank, most SaaS companies that have adopted UBP are figuring things out as they go, and that’s perfectly fine. You just have to be aware of the resources involved before committing.
You won’t monetize every customer the same way
When analyzing how much usage to give away for free, we realized that the average volume our competitors were offering was way higher than what the majority of Landbot customers will ever need.
It put us in a tough spot. If we match the competition, we might only be able to monetize a small fraction of customers through usage. If we don’t, our conversion rate might suffered.
After a few rounds of testing, we decided to go with the first option and monetize the remaining customers via features and seats.
This hybrid model offers a hidden benefit to products that serve a wide range of personas. It can push users to upgrade through any of the value metrics that are relevant to them.
For example, most B2B companies didn’t have enough top-funnel traffic to require the high chat allowance in our higher plans, but many still chose to upgrade for advanced integrations and conditional logic features.
However, this doesn’t mean you should get greedy and add a bunch of value metrics. Every value metric creates friction, and these frictions don’t simply add up — they compound.
Don’t try UBP if you can’t stomach the risk
There were months when we saw large MRR contractions due to usage drop. It made some of my teammates question whether UBP should stay.
I had to point out the following: “The contracted MRR came from usage in the first place. We can work on improving usage, but if we remove UBP, this entire growth lever is gone. Do we care more about overall MRR growth or keeping a secondary metric look pretty?”
Pricing changes are always risky, but the risk-to-reward ratio of usage-based pricing is asymmetric. This is perhaps the reason why monetization has been found to be the most effective growth pillar.
Make forward-looking decisions
Introducing usage-based pricing is considered a major pricing change. It’s rare for a SaaS company to make more than one major pricing change per year without confusing their customers or creating operational nightmares.
This means your UBP should be designed for not only the current state of your company but also its upcoming phase (1-3 years).
Bear in mind that your product will evolve, and so will your team, market, and competition. No amount of data will be enough to predict these changes. Most of the decisions will come down to qualitative judgment and convictions.
In our case, many decisions were not so clear-cut, but we ultimately went with what we believed would best fit our new strategy at the time.
UBP is one of many weapons in your company’s arsenal
Remember, usage-based pricing is not a magic solution to your growth problems. It’s only one potential lever in your overall growth model, but it can be a powerful one when executed well in the right context.
I hope these learnings about usage-based pricing have been helpful. If you believe UBP could be a great fit for your SaaS, why not give it a shot?
A version of this post was originally published on OpenView’s blog.
