Retention is the king of growth, but it can also be the silent killer if you don’t pay enough attention to it.
One thing I’ve noticed when talking to people in SaaS is that everyone seems to have a different definition of retention. That’s understandable because, well, there are indeed many ways to measure it.
The problem, however, is that most people are unaware of the distinctions between different retention measurements. As a result, they end up making misinformed decisions based on the wrong metrics or apple-to-orange benchmarking.
I haven’t found an article that clearly explains the differences between various retention metrics, so I decided to write one myself. In this guide, I will dive into the different ways of measuring retention in B2B SaaS and explain how each one should be used.
NOTE: The following metrics are designed for subscription-based B2B (and likely B2C) SaaS. They might not be suitable for other revenue models, such as e-commerce or pay-per-use products.
Key concepts
Before I get into the calculations, here are some key concepts you should understand:
Retention vs Churn
Retention and churn rates are two sides of the same coin. They both measure how well your customers are being retained but are inverses of each other.
For example, if your retention rate is 80%, your churn rate will then be 20%.
You can use either metric depending on whether you want to emphasize the percentage of customers lost or the percentage of customers retained in a given context.
Cancellation ≠ Churn (yet)
Cancellation happens when a customer asks to end their subscription at the next renewal, but they won’t be considered churn until the subscription actually expires.
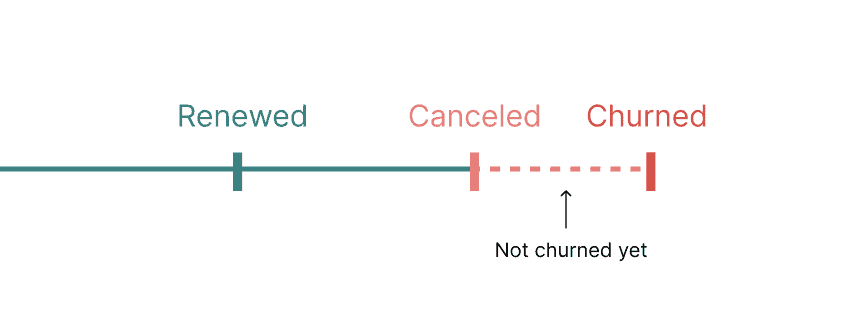
For example, if ACME Corp upgraded to a yearly plan in Jan 2022 and canceled in Mar 2022, the customer will be considered active until Jan 2023. This is because the plan is already paid for and will be valid for the entire year.
What this means: It is not possible for a new customer to churn within the first month. If you have a “free cancellation within X days” policy, customers who exercise it also shouldn’t be counted as churn because they never truly become customers (you should still track this behavior, however).
Now that you understand the basic concepts, let’s dive into the different ways of measuring retention along 2 dimensions:
1) Time reference
2) Type of retention
Time reference
Month-over-month retention
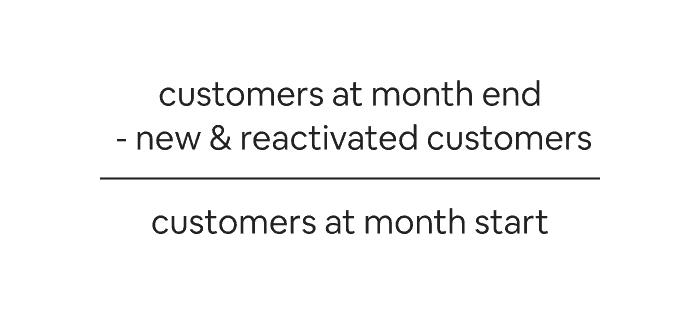
The most common way to measure retention is by comparing the number of customers retained at the end of a calendar month to the number at the beginning. It gives you an overview of how your retention rate changes over time, which is suitable for high-level reporting.
Here’s the formula to calculate it:
Example:
You have 100 paying customers at the beginning of October. 20 of them churned throughout the month. Among those who churned, 3 reactivated before the month ended. Your October retention rate will be: (100-20+3)/100) x 100% = 83%.
What about other intervals (day-over-day, week-over-week, and so on)?
In theory, the same formula can be applied to calculate day-over-day or week-over-week retention rate. However, I wouldn’t recommend doing so because these intervals are too short to show meaningful trends. You will likely end up overreacting to normal fluctuations.
On the other hand, if you use an interval that is longer than monthly, you must consider new customer churn (again, not possible in monthly retention calculation), which makes the math extremely complex. Don’t believe me? Even Shopify’s data team struggled to find a perfect solution.
If you have to report a longer period of data, I would recommend using the average MoM retention rate (unweighted).
For example, if you want to report your Q3 retention:
- Calculate the retention rate for June, July, and August separately.
- Add them up, then divide by 3.
Cohort (period-N) retention
While the MoM retention rate gives you an overview of top-level company health, it is not exactly actionable.
Since customers in different lifecycle stages are lumped together in the MoM retention calculation, the number can easily get skewed by your acquisition momentum. For example, if you did a big Product Hunt launch last month, your current MoM retention will look quite different simply because new customers (assuming the same quality) now make up a higher percentage of the total customer base.
To design an effective retention strategy, you need to understand the retention rate for each customer lifecycle stage. We’ll do so by look at cohort retention.
Here’s how:
- Group customers who convert in the same calendar period (usually a week or a month) as a cohort.
- Find out the percentage of customers retained in each subsequent period (period N), relative to the number in the starting period (period 0).
- A period here should be defined as “rolling X-days”. For example, “Month 1” = Day 31-60 after the date a customer enters the cohort. It’s not the end of the world if you use calendar months. Just note that the data can be skewed by the distribution of cohort joining dates.
- Repeat for each cohort.
The end result is usually presented in the following format:
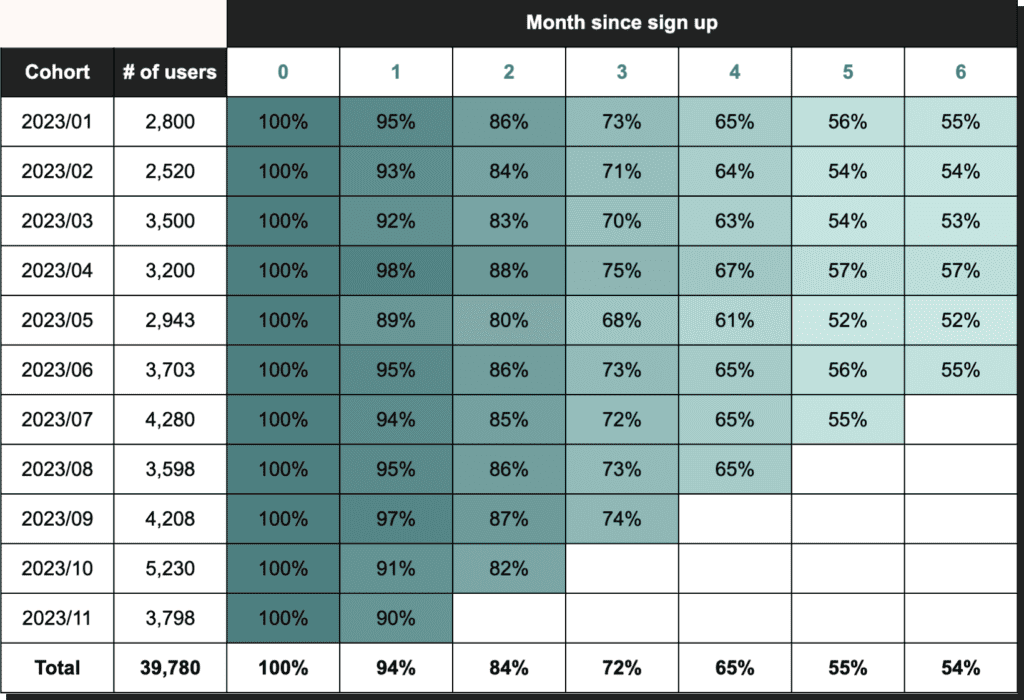
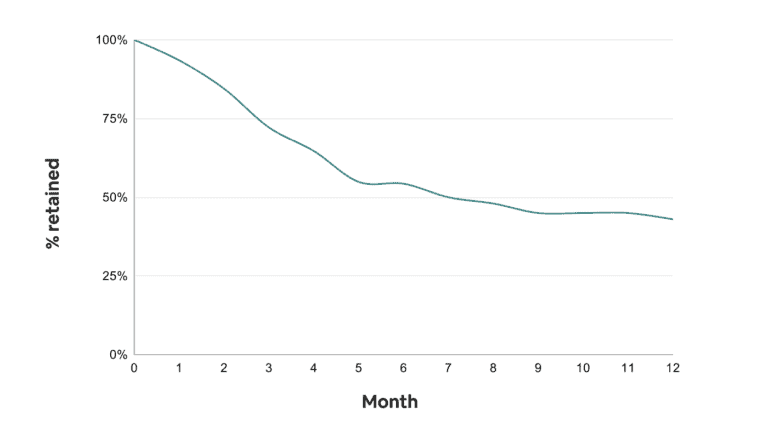
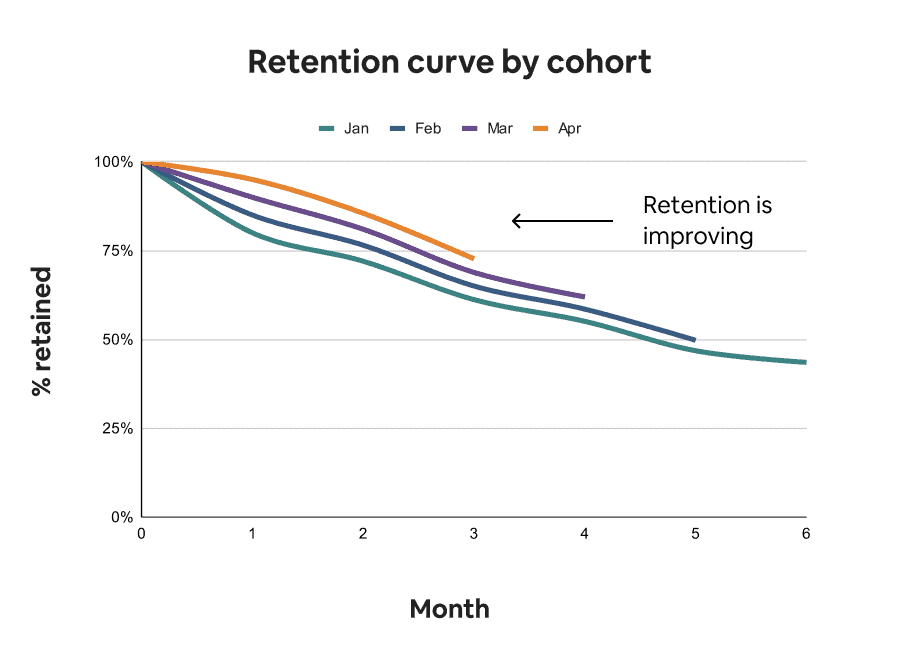
You can then turn the average retention rates (weighted) into a retention curve. The sooner the curve flattens, the better your retention is.
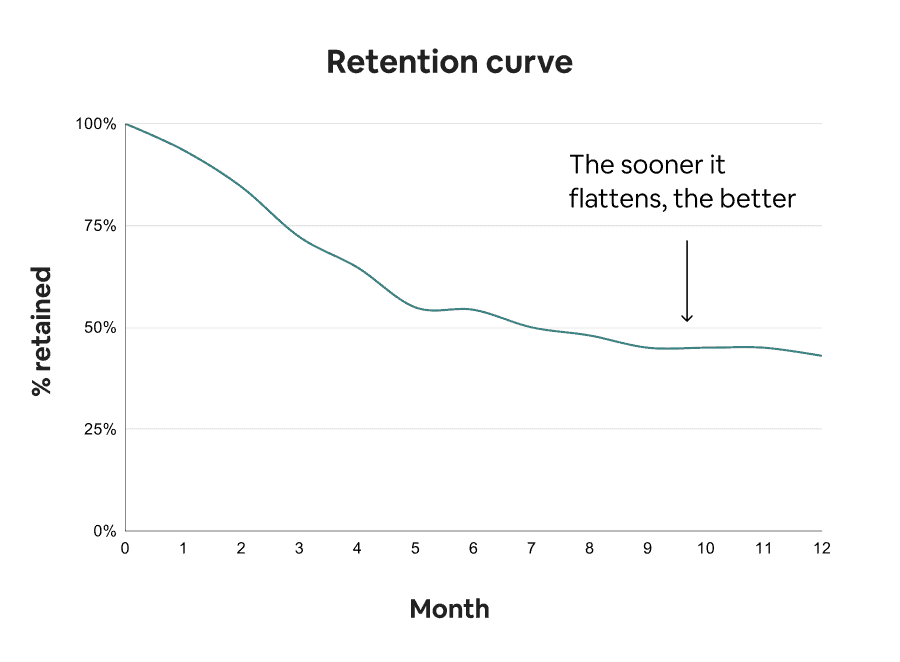
In this graph, you can also identify which lifecycle stage shows the steepest drop off, so you can prioritize your efforts to improve it. (Spoiler: it’s usually the earlier stages.)
To understand whether your initiatives are working, simply turn each cohort into a retention curve and plot all the curves on the same graph. If newer curves appear to go down more gradually, it means your retention is improving.
Type of retention
Logo retention vs Net MRR retention
Traditionally, people only think of retention as the percentage of customers retained (aka logo retention). However, not all customers contribute equally to a company’s MRR, especially if you drive expansion revenue through usage-based pricing.
This is why net MRR retention (aka net dollar/revenue retention) has become the primary retention metric in B2B SaaS. Here is how you calculate it:

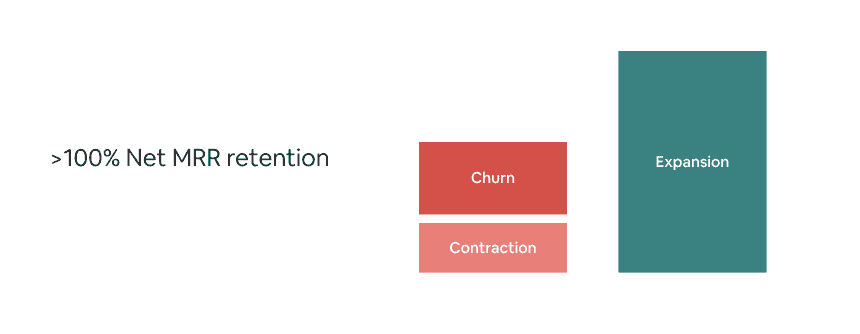
Net MRR retention takes into account not only MRR lost through churn, but also changes in MRR due to contraction and expansion. This means that it is possible to reach a net MRR retention rate greater than 100%, also known as negative revenue churn — a feat that sets top SaaS companies apart from the crowd.
If you want to understand what is driving your net MRR retention, you can further break it down by expansion lever:
- Seat
- Usage
- Plan
- Professional services
It’s important to look at both logo retention and net MRR retention to get a complete picture of “how” your company is growing, so you can use the data to inform your GTM and product strategies.
Enjoying this post so far? Subscribe for more.
Usage retention
Whereas revenue retention measures how well you are capturing value, usage retention measures how well you are giving value.
Although revenue is what matters at the end of the day, it is a lagging indicator. If a customer stops using the product, churn will follow soon. That’s why you must also measure retention from a usage perspective.
To do so, the main question you want to ask is:
After conversion, what % of customers are still experiencing value in period N?
But before you can answer the question, you must first define a few elements:
1. Value signal
Most SaaS companies define users who log in as “active.”
But “logging in” is not strong enough of an indicator that users are getting value from the product. In fact, some products don’t even require users to log in to get value.
For example: Once a company has built a website using Webflow, they won’t have to edit it too frequently. However, they will still be getting value whenever someone visits the site.
For this reason, you must pick a value signal that makes the most sense for your specific product. Here is a simple process you can follow to define your value signal:
- Select 3-5 potential value signals based on informed hypotheses.
- Perform correlation analysis to find the correlation between each candidate and long-term revenue retention (per your definition of “long-term”).
- Pick a winner based on the result.
Correlation analysis can be performed using most analytics tools, such as Mixpanel and Amplitude, but if you have a data team that can help, that’ll be even better!
It’s worth noting that a signal with the highest correlation coefficient should not automatically be chosen as the winner (remember, correlation ≠ causation). You must also apply some qualitative judgment to make the final call. As a rule of thumb, the best value signals tend to be those that are understandable, measurable, and actionable.
My suggestion is to not get too hung up on finding the perfect value signal. Pick something that is directionally correct and review it from time to time.
2. Period
Unlike revenue retention, which is measured on a monthly basis, usage retention might require a different measurement period depending on your product’s natural usage frequency. It could be either:
- Daily
- Weekly
- Monthly
- Quarterly / Yearly
- Custom brackets (e.g., 1-3 days, 4-7 days, 8-14 days, etc.)
It’s important to define the natural usage frequency based on how often you believe the product should deliver value rather than how your users are currently using it.
For example: If your product is a to-do list app that is supposed to be used at least once a week, but most of your users only use it once a month, that doesn’t mean your product’s usage frequency should be monthly; It simply means you have a lot of work to do.
3. Day-N vs Unbound retention
There are two ways to measure usage retention:
- Day-N retention (most people call it N-day, but I think day-N is more accurate): Users who come back exactly in a specific period
- Unbound retention (aka rolling retention): Users who come back in or after a specific period
Unbound retention might be useful for some B2C products, but in the context of B2B SaaS, I recommend using Day-N retention exclusively.
4. Company vs User
For most B2B SaaS products, tracking usage retention at the company level is enough. However, it does not hurt to track user-level retention to gain additional insights.
For example, a whiteboarding tool like Miro is supposed to be used by multiple teammates for remote collaboration. An account can’t be considered healthy if all the activities come from a single user, and the only way you can catch this issue is by tracking usage retention at the user level.
Bonus concepts
Since we are on the topic of retention, let me also explain a few other relevant concepts:
Voluntary vs Involuntary churn
Voluntary churn happens when a customer cancels willingly. This is the most common type of churn you will see.
Involuntary (aka delinquent) churn happens when a customer’s credit card gets declined for unintended reasons (expired, stolen, limit reached, etc.). According to ProfitWell’s study, 20-40% of churn is involuntary, so it’s definitely not a group you can ignore.
Retention vs Engagement
Usage retention measures whether a customer still uses the product after X period of time. The result is either a yes or a no.
Engagement, on the other hand, goes much deeper to measure the intensity of product usage among retained users. There are no universal engagement metrics because they must be tailored to the nature of each product, but here are some high-level examples:
- # of times a value signal is triggered
- # of times a key feature is used
- # of unique features used
Retention starts with activation
Before you go, I’ll give you one extra piece of advice on improving retention.
Many SaaS companies try to reduce churn by adding friction to their cancellation flows or having customer success teams talk customers out of leaving. These tactics have never worked, and never will. By the time a customer has decided to leave, it is already too late.
In order to truly improve retention, you have to start with activation.
Get new users to experience your product’s value as quickly as possible and form a habit of using it. Once you’ve activated these users, you have to push them to become power users while also consistently releasing game-changing features to increase the switching cost. None of these tasks are easy, which is even more of a reason to not waste time on last-minute hacks.
If you want to know how your retention rate stacks up against the benchmark, here are some resources you might find helpful:
